
What Is Tach and Why It’s a Powerful Code Visualization Tool
If you’ve ever opened a Python project after months away — or inherited someone else’s codebase — you know that sinking feeling. Files everywhere, imports tangled like headphone cables, and absolutely no map to guide you. That’s exactly the problem Tach was built to solve.
Tach is an open-source code visualization tool developed by Gauge Technologies and backed by Y Combinator. It was built specifically for Python projects, with one clear mission: give developers visibility into how their code is actually structured, and then give them the tools to improve it. It’s installable via pip, written in Rust for speed, and designed to be adopted incrementally — meaning you don’t have to overhaul your entire project to start benefiting from it.
What makes Tach stand out among developer productivity tools is its unique combination of visualization and enforcement. Most tools either show you what your code looks like or let you define rules for how it should behave. Tach does both. You get a clear dependency graph, plus a linter-style check that runs in CI/CD and pre-commit hooks to make sure developers don’t accidentally break the architecture you’ve defined.
According to Tach’s official documentation at docs.gauge.sh, the tool has zero runtime impact on your application — it’s purely a development-time utility. That’s a huge win for teams that want architectural guardrails without any performance overhead. It’s also interoperable with your existing systems, from VS Code to GitHub Actions, making it a natural fit for teams that want to improve code quality without disrupting their current workflow.
2. How a Code Visualization Tool Builds a Code Dependency Graph
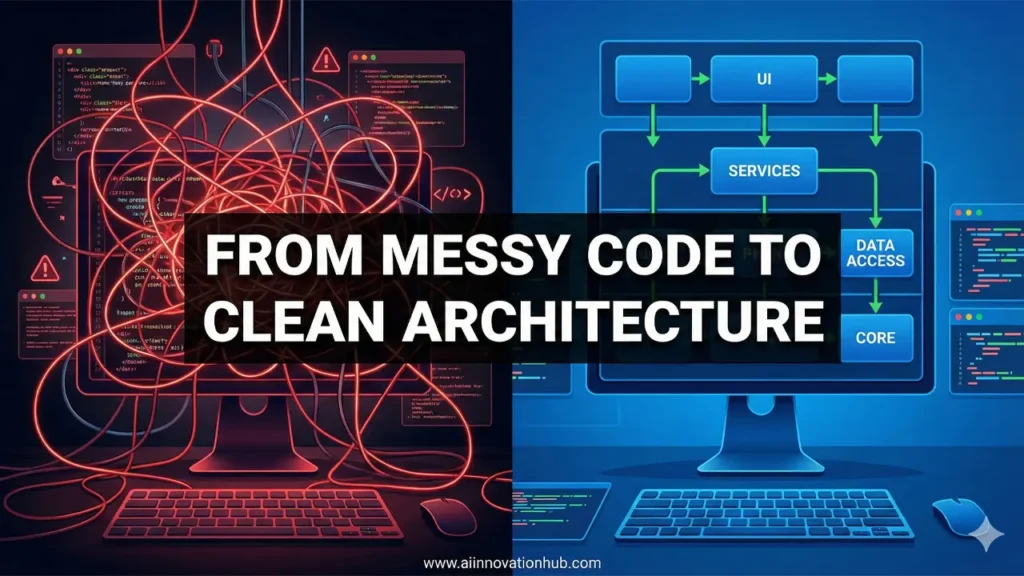
At the heart of Tach is its ability to generate a code dependency graph — a visual map of how your Python modules relate to each other. This isn’t just a fancy diagram; it’s a living representation of your codebase’s true structure.
Running tach show from your project root generates a tach_module_graph.dot file in GraphViz DOT format locally. For an interactive web-based view, tach show --web sends your configuration to a remote viewer where the graph is rendered visually. According to the official GitHub repository, this graph is generated from the contents of your tach.toml configuration file, reflecting your declared module boundaries.
The dependency graph does more than look pretty. It shows you exactly which modules depend on which, where circular dependencies lurk, and which parts of your codebase are most tightly coupled. When Tach encounters an undeclared import — say, moduleA importing from moduleB without that dependency being listed — it flags it immediately with a clear error message like:
❌ tach/check.py[L8]: Cannot use 'tach.filesystem'. Module 'tach' cannot depend on 'tach.filesystem'.Each error in the output is hyperlink-enabled in supported terminals, letting you jump directly to the offending line. This level of precision transforms a code dependency graph from a passive diagram into an active feedback loop that guides developers toward better decisions in real time.
You can also generate detailed reports for any individual path using tach report my_package/, which lists both the dependencies of a module and the usages by other modules. This bidirectional view is invaluable when planning refactors or evaluating the impact of changes.
3. Visualize Code Architecture: Why Developers Need Structural Clarity
Here’s a truth most developers learn the hard way: code that works is not the same as code that’s well-designed. A codebase can pass all its tests, ship new features on time, and still be a structural nightmare underneath the surface — with hidden dependencies that make every change feel like defusing a bomb.
The ability to visualize code architecture is what separates reactive maintenance from proactive design. When you can see your architecture laid out as a graph, patterns become obvious. You see the module that everyone depends on but nobody owns. You spot the layer that’s supposed to be independent but secretly imports from half the codebase. You identify the circular dependencies that slow down build times and make reasoning about code nearly impossible.
Tach makes this structural clarity accessible without requiring you to write any diagramming code. You don’t need to maintain a separate architecture document that inevitably goes stale. The graph is generated from your actual imports — which means it reflects reality, not aspirations.
For teams working on growing Python projects, the ability to visualize code architecture is also a communication tool. When a senior engineer wants to explain the system to a new hire, a dependency graph is worth ten thousand words of documentation. When a tech lead wants to justify a refactor to management, showing the current spaghetti architecture and the proposed clean state makes the case instantly.
4. Software Architecture Visualization vs Code Generators
There’s an important distinction worth drawing between tools that do software architecture visualization and tools that generate code or scaffolding. They serve very different purposes, and conflating them leads to frustrated developers who bought a map when they needed a compass.
Code generators — tools like Yeoman, Cookiecutter, or framework CLIs — help you create structure at the start of a project. They’re great for boilerplate, but they can’t tell you how your architecture has evolved (or devolved) over the months and years since you ran that init command.
Software architecture visualization tools like Tach do something fundamentally different: they analyze what already exists. They read your current imports, map your existing modules, and surface the real structure of your system — not the idealized version from day one. This is a critical capability for any team that has been shipping features for more than a few months.
Architecture Enforcement Matrix
Comparing the capabilities of generative frameworks against active architectural enforcement tools for Python.
| Enforcement Feature | Code Generators | Tach (Observability) |
|---|---|---|
| Legacy Code Compatibility | ✕ | ✓ |
| Dependency Violation Alerts | ✕ | ✓ |
| CI/CD Gatekeeping | ✕ | ✓ |
| Visual Dependency Graph | ✕ | ✓ |
| Zero Runtime Overhead | ✓ | ✓ |
| Module Boundary Lockdown | ✕ | ✓ |
| Incremental Adoption Flow | ✕ | ✓ |
Tach Advantage
Unlike generators that create new silos, Tach enforces boundaries on your existing code, preventing “Spaghetti Logic” in production.
Enable architectural linting on legacy modules without rewriting.
Generate real-time maps of module relationships automatically.
Explicitly define public vs. private interfaces for internal modules.
Scroll to compare all 7 architectural dimensions
Tach’s approach to software architecture visualization is also notable because it doesn’t require you to change your code before using it. You run tach mod to interactively mark module boundaries, run tach sync to auto-populate the dependency rules from your actual imports, and then you have a working configuration — no rewriting required.

5. How Tach Helps You Understand Legacy Code Fast
Let’s talk about the elephant in the room: legacy code. Whether it’s a five-year-old Django monolith or a data pipeline stitched together by three different engineering teams, legacy codebases are one of the most common and most frustrating challenges in software development.
The traditional way to understand legacy code is painful: you read file after file, try to trace imports manually, draw diagrams on whiteboards, and ask colleagues who’ve long since moved on. It’s time-consuming, error-prone, and deeply unsatisfying.
Tach dramatically shortens this process. According to the Gauge blog, taming the complexity of a legacy codebase is daunting — but an incremental approach is often the best option. Tach lets you start with permissive configuration and gradually ratchet up toward a well-defined modular monolith.
Here’s what that looks like in practice. When you run tach mod on a legacy project, you get an interactive file tree where you mark your module boundaries. You don’t have to define perfect boundaries right away. You can start by marking just the top-level packages, then run tach sync --add to auto-detect all the dependencies currently in use. The result is a tach.toml file that accurately reflects your codebase as it actually exists today — messy dependencies and all.
From there, you can run tach check to see which modules are violating the boundaries you’ve set, and tach report my_module/ to understand exactly which other parts of the code depend on or are depended upon by any given module. For teams inheriting a large legacy system, this is game-changing. Instead of weeks of archaeology, you get a structured map in hours.
Tach also supports marking dependencies as deprecated — a feature that’s particularly useful for legacy cleanup. You can flag a dependency without immediately breaking builds, giving teams a visible signal to migrate away from old patterns over time.
6. Codebase Analysis Tool: Breaking Down Complex Projects
Tach isn’t just a visualization layer — it’s a full-featured codebase analysis tool with the depth to handle projects of any scale. Gauge’s official blog post on scaling Tach to large codebases outlines how the tool handles organizations with more than 1,000 modules and teams pushing over 1,000 commits per day.
For large-scale projects, Tach introduces two powerful features: Layers and Distributed Configuration.
Layers allow you to define a vertical architecture — similar to the classic Presentation / Business Logic / Data separation found in web applications. In Tach’s tach.toml, you can define an ordered list of layers like ["ui", "commands", "core"]. Modules assigned to higher layers may freely import from lower layers, while lower layers are forbidden from importing upward. This creates a clean, enforced hierarchy without requiring you to list every single inter-module dependency explicitly.
Distributed configuration, meanwhile, allows teams working on large monorepos to split their Tach configuration across multiple tach.domain.toml files that live alongside the relevant source code. According to the official documentation, this means teams can use tools like CODEOWNERS to maintain their own Tach configuration, and these files serve as living documentation for other developers who need to understand how modules fit together.
Tach CLI Reference
Standardized commands for initializing, synchronizing, and enforcing Python module boundaries.
| Command Interface | Operational Logic | Target Use Case |
|---|---|---|
tach mod |
Interactive module initialization and schema setup. | Initial Config |
tach sync |
Synchronizes defined constraints with actual codebase imports. | Auto-Dependency |
tach check |
Validates and enforces module boundary integrity. | CI/CD & Verification |
tach show |
Generates a static dependency graph in DOT format. | Local Visualization |
tach show --web |
Launches an interactive, shareable web-based dependency graph. | Peer Review |
tach report <path> |
Detailed analysis of dependencies and usage patterns for a specific path. | Impact Analysis |
tach mod SetupInteractive module initialization and schema configuration.
tach check EnforceValidates and enforces module boundary integrity in CI/CD.
Detailed docs available for all 6 core commands
This command set makes Tach one of the most comprehensive codebase analysis tools available for Python teams today. Whether you’re running it locally during development or embedding it into a GitHub Actions workflow, each command adds a distinct layer of structural insight.
7. How to Analyze Code Structure and Find Hidden Problems
One of the most powerful things you can do with Tach is use it to analyze code structure and uncover problems that aren’t visible through normal testing or code review. Tests verify behavior; Tach verifies structure.
Here are some of the hidden problems Tach surfaces:
Circular dependencies. When module A depends on module B, which depends on module A, you’ve got a circular dependency. These are notoriously difficult to detect through manual reading, and they can cause import errors, slow startup times, and tightly coupled code that resists change. Tach can be configured with forbid_circular_dependencies = true in tach.toml to catch these automatically.
Undeclared dependencies. Code that imports from modules not listed as official dependencies is a silent ticking clock. It works until it doesn’t — usually at the worst possible moment. Tach’s tach check command catches every undeclared import and flags it before it reaches production.
Unused declared dependencies. With exact = true in the configuration, tach check will also fail if you’ve declared a dependency that’s no longer actually used. This prevents stale configuration from accumulating over time and keeps your architecture documentation honest.
Public interface violations. Tach allows modules to define explicit public interfaces. Any import that bypasses these interfaces — going directly into internal implementation files — will be flagged. This is especially useful for library-style modules that should expose a clean API while hiding their internals.
To analyze code structure for a specific module, tach report python/my_module/ gives you a precise breakdown: which files within that module import from where, and which other modules are importing from it. This bidirectional view is the foundation of safe refactoring.
8. Refactor Messy Code Without Guesswork
Refactoring is one of the most valuable things a development team can do — and one of the most terrifying. When you don’t know all the places a module is used, touching it feels like pulling a thread on a sweater. Everything might unravel. The fear of breaking things leads to stagnation, and stagnation leads to ever-increasing technical debt.
Tach is purpose-built to help teams refactor messy code with confidence instead of anxiety.
The first step is getting a clear picture of what you’re dealing with. tach show --web gives your team an interactive dependency graph showing every module and every connection. Suddenly you can see which modules are “hubs” — heavily connected nodes that everything depends on — and which are safely isolated.
From there, the tach report command tells you exactly which files import from a given module and how. Before you rename, move, or restructure anything, you have a complete dependency map. No more searching through the codebase with grep, hoping you haven’t missed any obscure import hidden in a conditional block.
Tach’s deprecated dependency feature is particularly elegant for gradual refactoring. You can mark a dependency as deprecated, and Tach won’t fail your build — but it will surface every usage of that dependency so your team can track and eliminate them systematically. According to the official documentation, this allows teams to deprecate dependencies over time, creating a sustainable path from a tangled state to a clean one.
Finally, once you’ve completed a refactor, you can run tach sync to automatically update your tach.toml configuration to reflect the new structure. Your architecture documentation stays in sync with your actual code, which means future developers working on the project will always have an accurate map.
9. Clean Code Architecture: From Spaghetti to Scalable
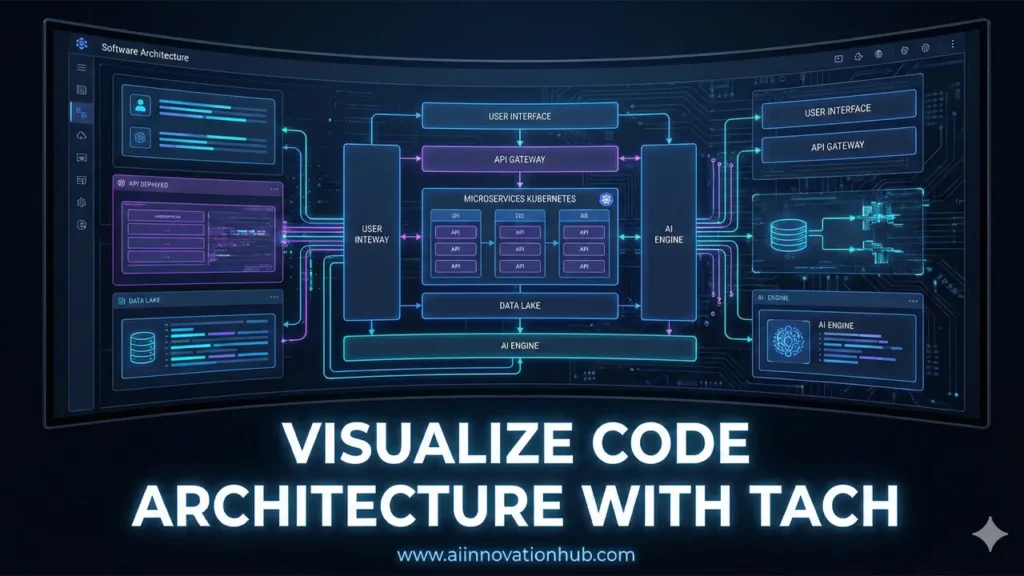
The ultimate goal of everything Tach enables is clean code architecture — a codebase where modules have clear responsibilities, dependencies flow in predictable directions, and any developer can understand the system’s structure without an expedition through hundreds of files.
Clean architecture isn’t just an aesthetic preference. According to Gauge’s Y Combinator launch post, as a team and codebase grow, code gets tangled up — and this hurts developer velocity and increases cognitive load. Over time, this silent killer can become a show stopper. Tooling breaks down and teams grind to a halt.
Tach’s layered architecture feature is one of the most practical paths toward clean architecture for existing Python projects. By defining layers like ["api", "product", "platform", "persistence"], you create a vertical hierarchy where each layer has a clear role and clear rules about what it can access. Higher layers may import from lower ones; lower layers may never reach upward. This mirrors the classic dependency inversion principle at a module level.
The journey from spaghetti to scalable typically looks like this with Tach:
- Map — Run
tach modandtach syncto create an accurate picture of your current architecture, however messy it may be. - Visualize — Use
tach show --webto share the dependency graph with your team and identify the worst problem areas. - Define — Begin defining layers and desired module boundaries in
tach.toml, starting with the clearest separations. - Enforce — Add
tach checkto your CI pipeline so that no new violations can enter the codebase. - Deprecate — Mark problematic legacy dependencies as deprecated and track their removal over time.
- Iterate — Gradually tighten your configuration, moving toward
exact = trueandforbid_circular_dependencies = trueas your architecture matures.
What makes this journey manageable is Tach’s commitment to incremental adoption. You don’t have to achieve perfection before you start enforcing rules. You can lock in today’s state as a baseline and improve from there — which is a realistic, sustainable approach to architectural improvement.
10. Why Every Developer Needs a Code Visualization Tool in 2026
Software development in 2026 is faster, more collaborative, and more complex than ever before. AI coding assistants can generate hundreds of lines of code in seconds. Microservices are merging back into modular monoliths as teams discover the operational overhead of distributed systems. Codebases that once took teams of 10 years to build can now be assembled by teams of 3 in months. In this environment, the ability to understand, govern, and communicate the structure of your code isn’t a nice-to-have — it’s a core engineering discipline.
A code visualization tool like Tach is no longer just for large enterprises maintaining multi-million-line legacy systems. It’s for any team that wants to move fast without breaking things, onboard new engineers without weeks of painful archaeology, and make architectural decisions based on facts rather than assumptions.
Tach specifically checks all the right boxes for Python developers in 2026. It’s open source, which means no vendor lock-in and a community that continues to improve it. It’s implemented in Rust, which means it’s fast enough to run on the largest codebases without slowing down your CI pipeline. It integrates with VS Code, pre-commit hooks, and any CI/CD system. And it requires no runtime changes to your application — you add it to your development workflow, not your production dependencies.
Whether you’re building a new service and want to establish good architectural habits from day one, or you’re inheriting a sprawling legacy system and need a map before you take a single step, Tach gives you the structural clarity that turns uncertain maintenance into confident engineering.
The developers who will thrive in 2026 are not necessarily the ones who write the most code the fastest. They’re the ones who understand their systems deeply, communicate architecture clearly, and build habits that scale. A code visualization tool is the foundation of all three.
If you’re passionate about technology that transforms complexity into clarity, you’ll love exploring the next frontier of smart hardware. From intelligent developer tools to cutting-edge manufacturing machines, innovation is everywhere. Discover powerful, affordable 3D printing solutions and in-depth reviews at https://bestchina3dprinters.com/ and see what modern engineering can really do.